Atlassian
Lead Visualization Engineer · 2021 – Present
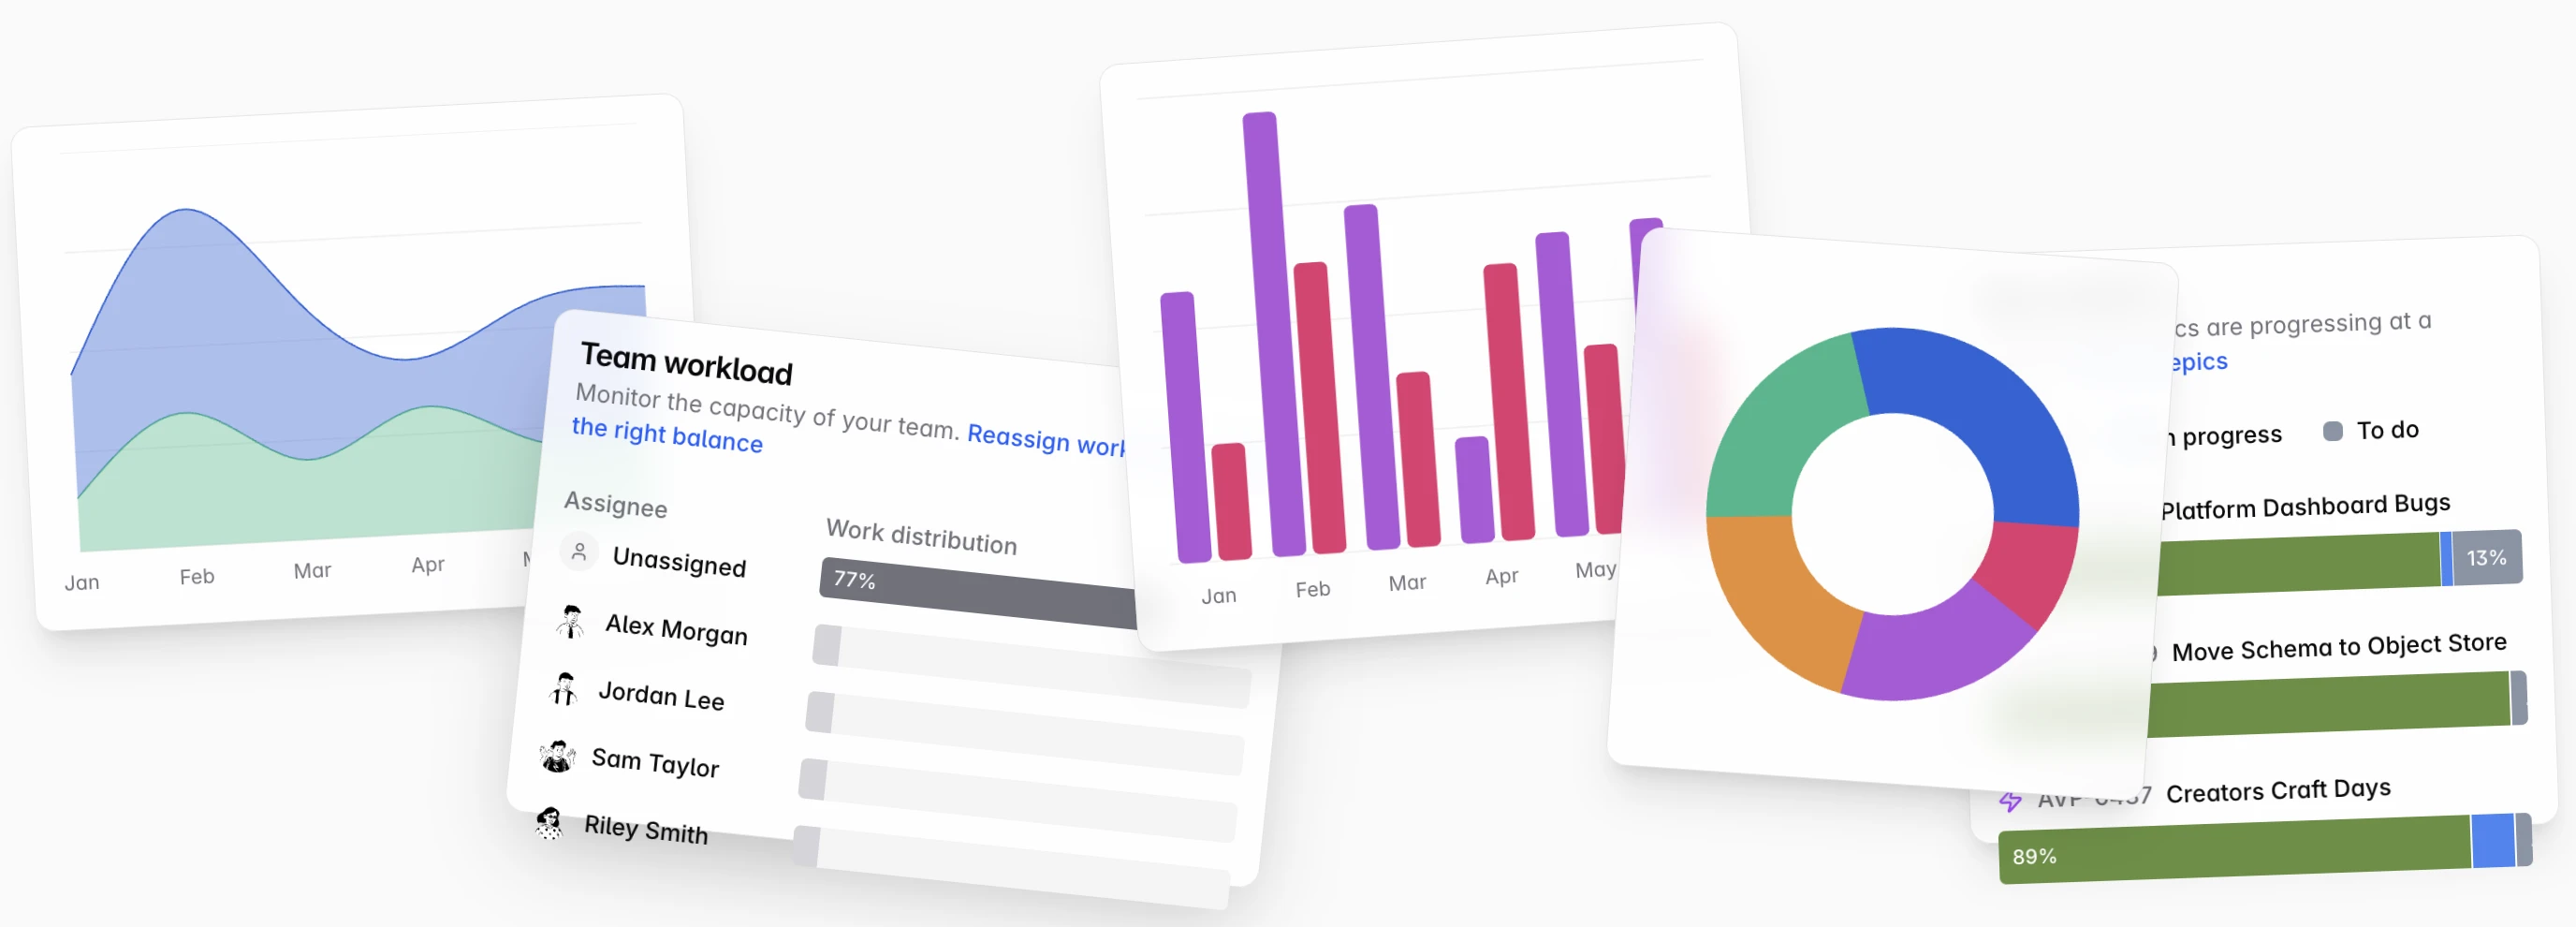
Viz Platform Charts
Designed and built @atlassian/viz-platform-charts from the ground up. Atlassian's primary data visualization library, serving 28+ engineering teams and 4M MAU. A novel slot-based React composition model lets teams assemble custom chart experiences — opened to company-wide contribution through a structured model and an AI-assisted authoring path.
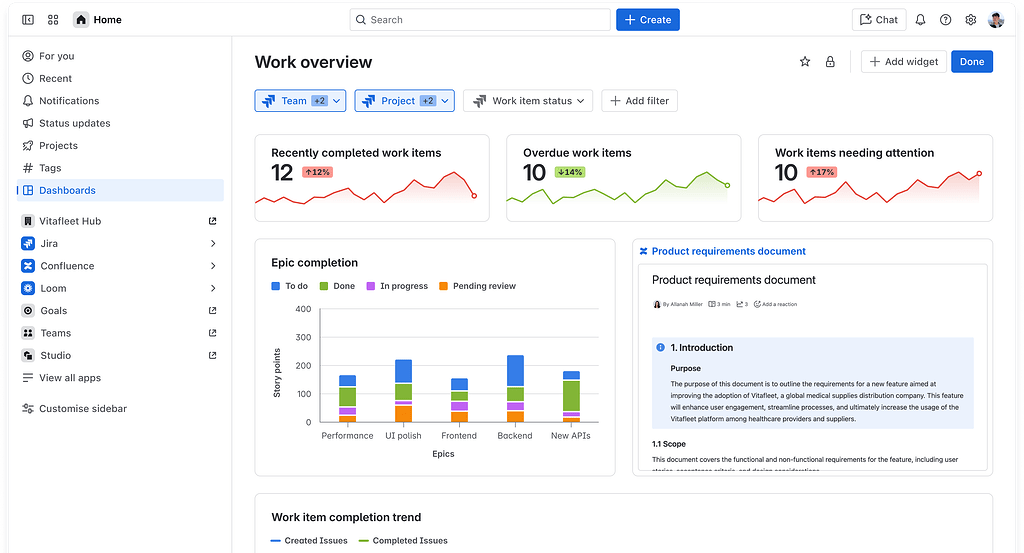
Home Dashboards
Led the visualization surfaces powering Atlassian Home dashboards — the central hub where users see activity and metrics across all Atlassian products. Built on the viz platform charts library.

Forge UI Visualizations
Extended the viz platform to support the new Forge UI — enabling third-party developers to embed rich chart experiences in their Atlassian apps.
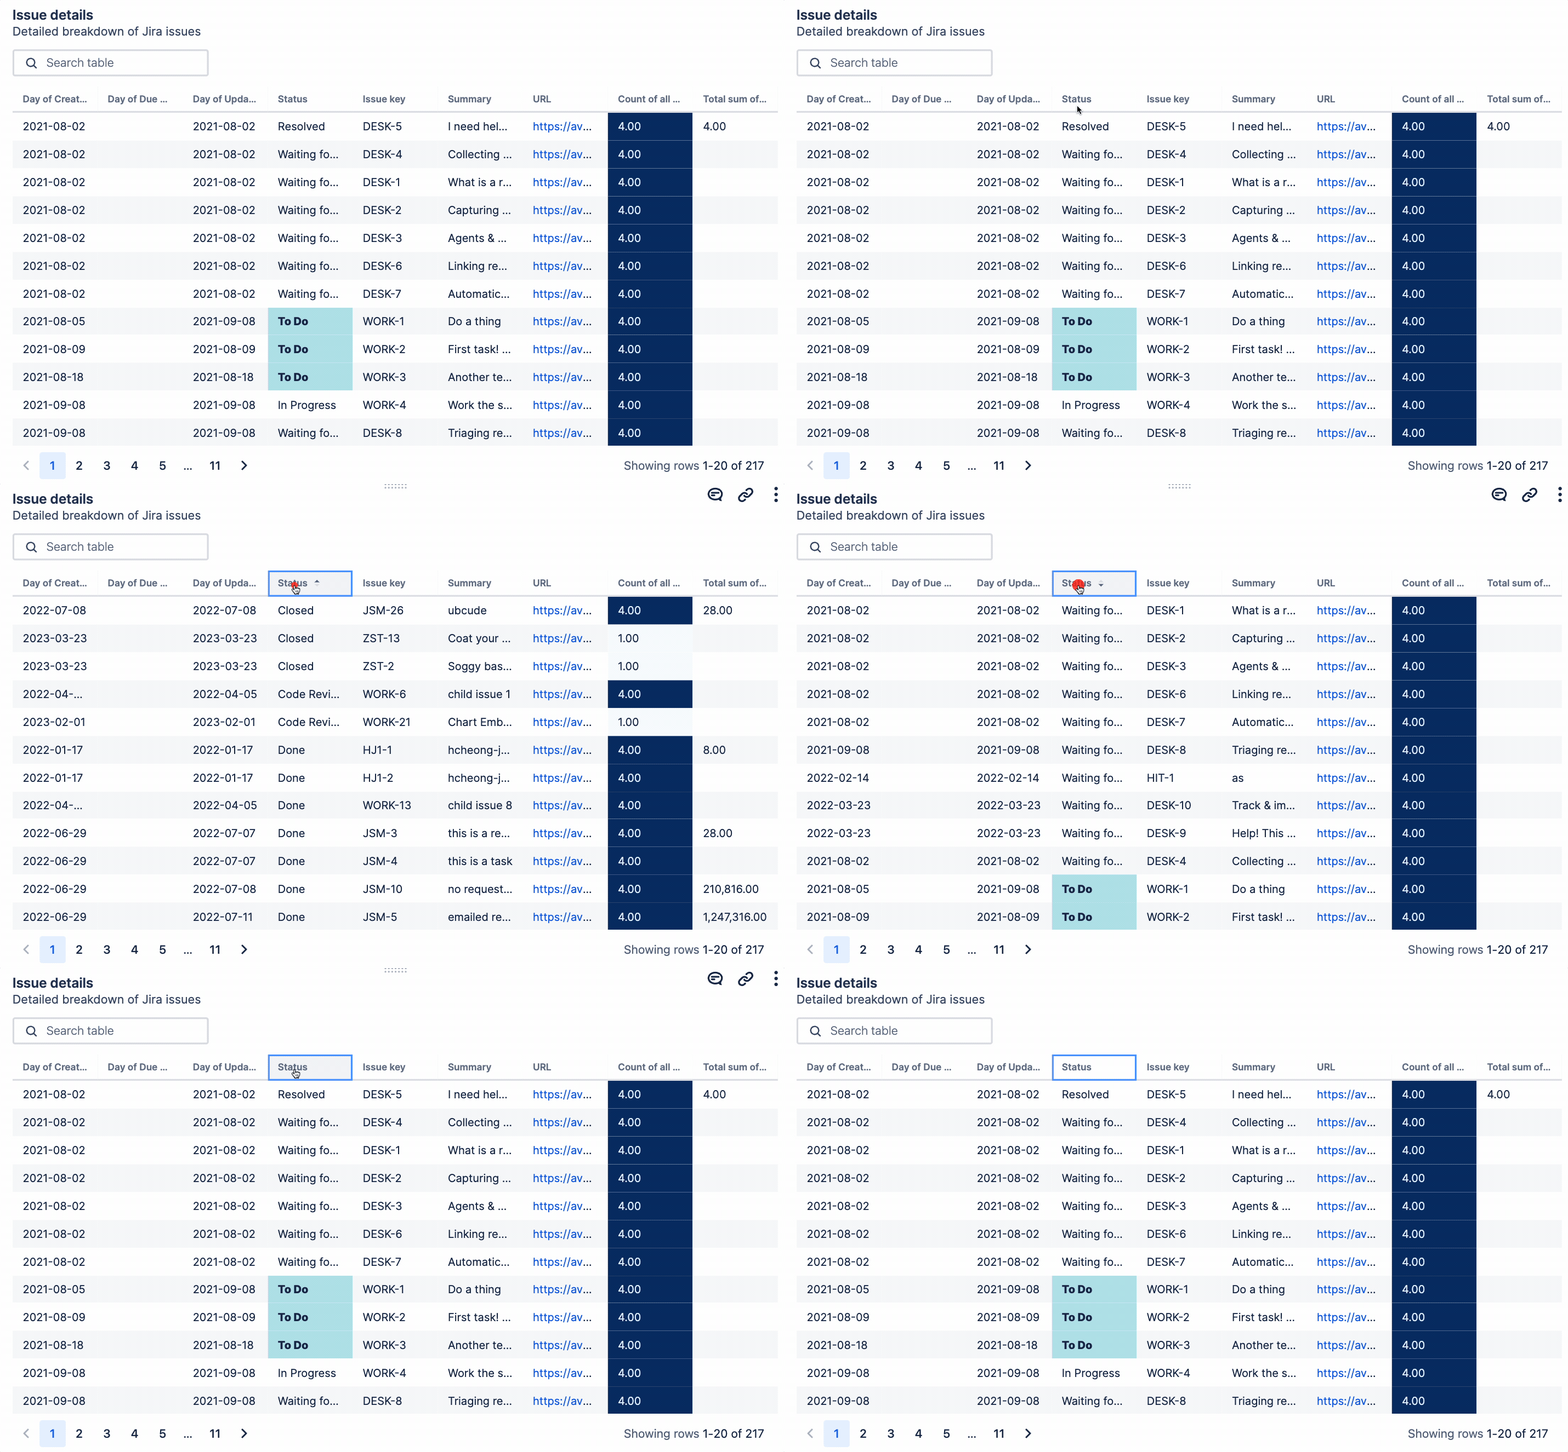
Table Chart Rebuild
Tech-led the table chart rebuild — Atlassian Analytics' most-used chart — and the creation of custom mini-visualizations like sparklines and auto-heatmaps, features that weren't possible under the legacy architecture.
Chartio
Lead Visualization Engineer · 2019 – 2021
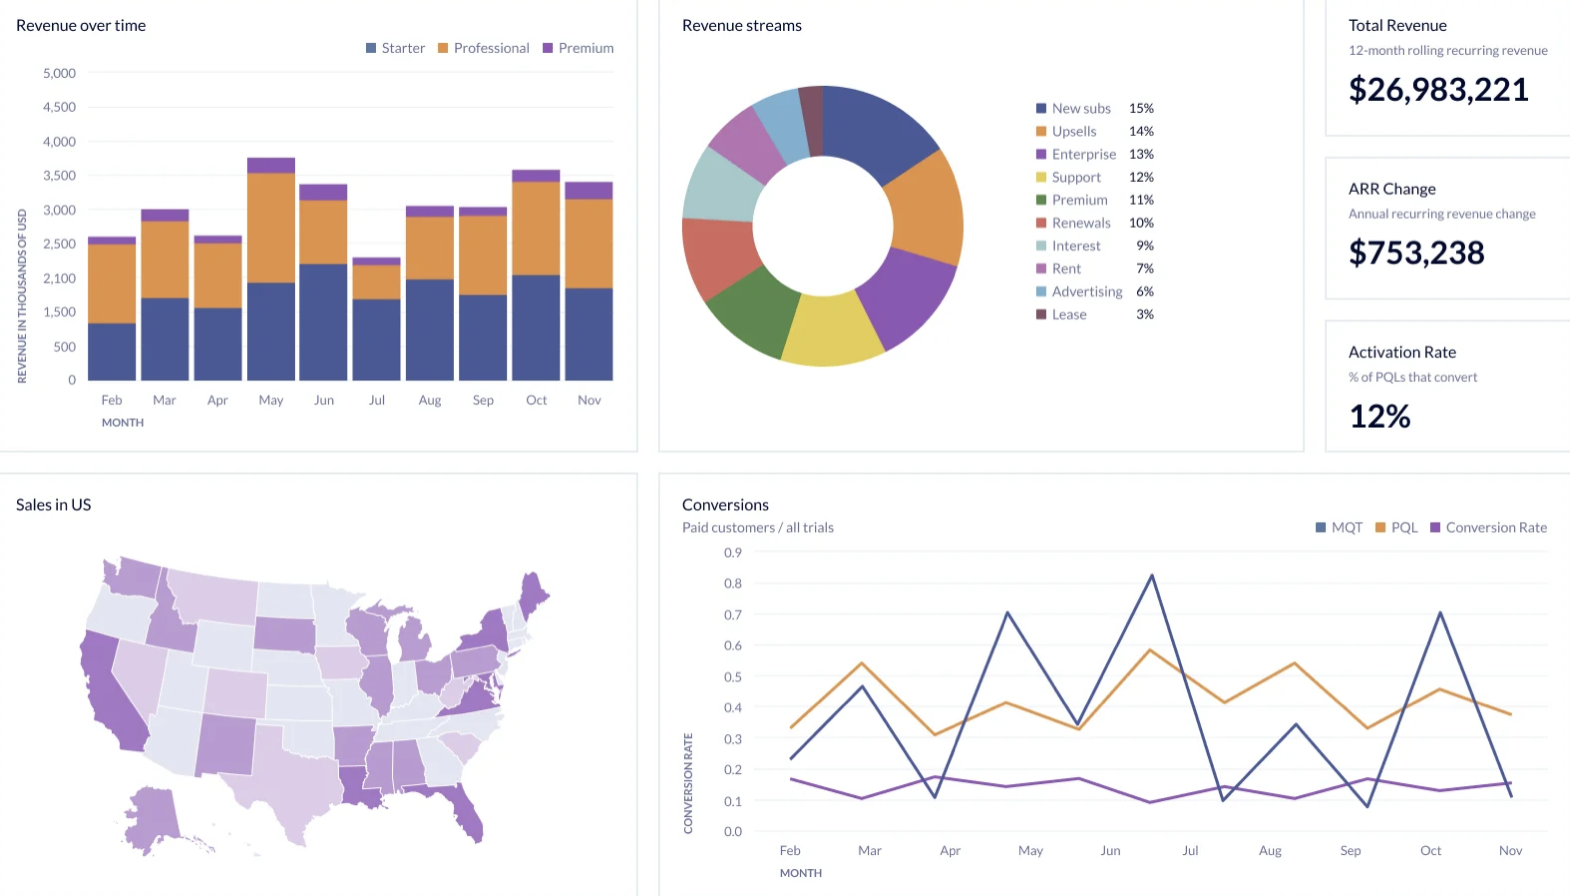
Vega-Lite Visualization Library
Architected Chartio's Vega-Lite-based visualization library — designed the grammar layer, authoring experience, and chart catalog.

Sparklines & New Chart Types
Shipped new chart types including sparklines and an all-new chart catalog for Chartio customers.

How We Feel
A public data visualization built in partnership with the How We Feel app — pandemic user-generated data turned into shared insight.
Two Six Labs
Data Visualization Scientist & Research Engineer · 2018 – 2019
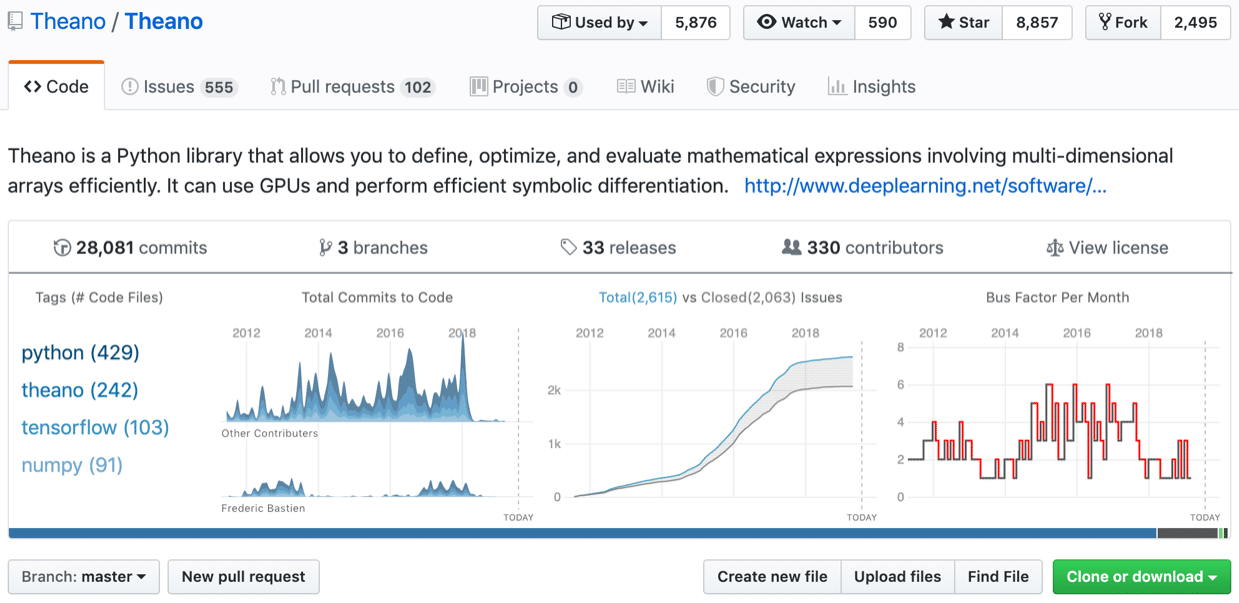
Code Repository Analysis Tool
Co-authored best-paper winner at VDA 2020 (Haber & Gove): a visualization tool for analyzing the suitability of software libraries via their code repositories. Inventor on US Patent 11,487,538.
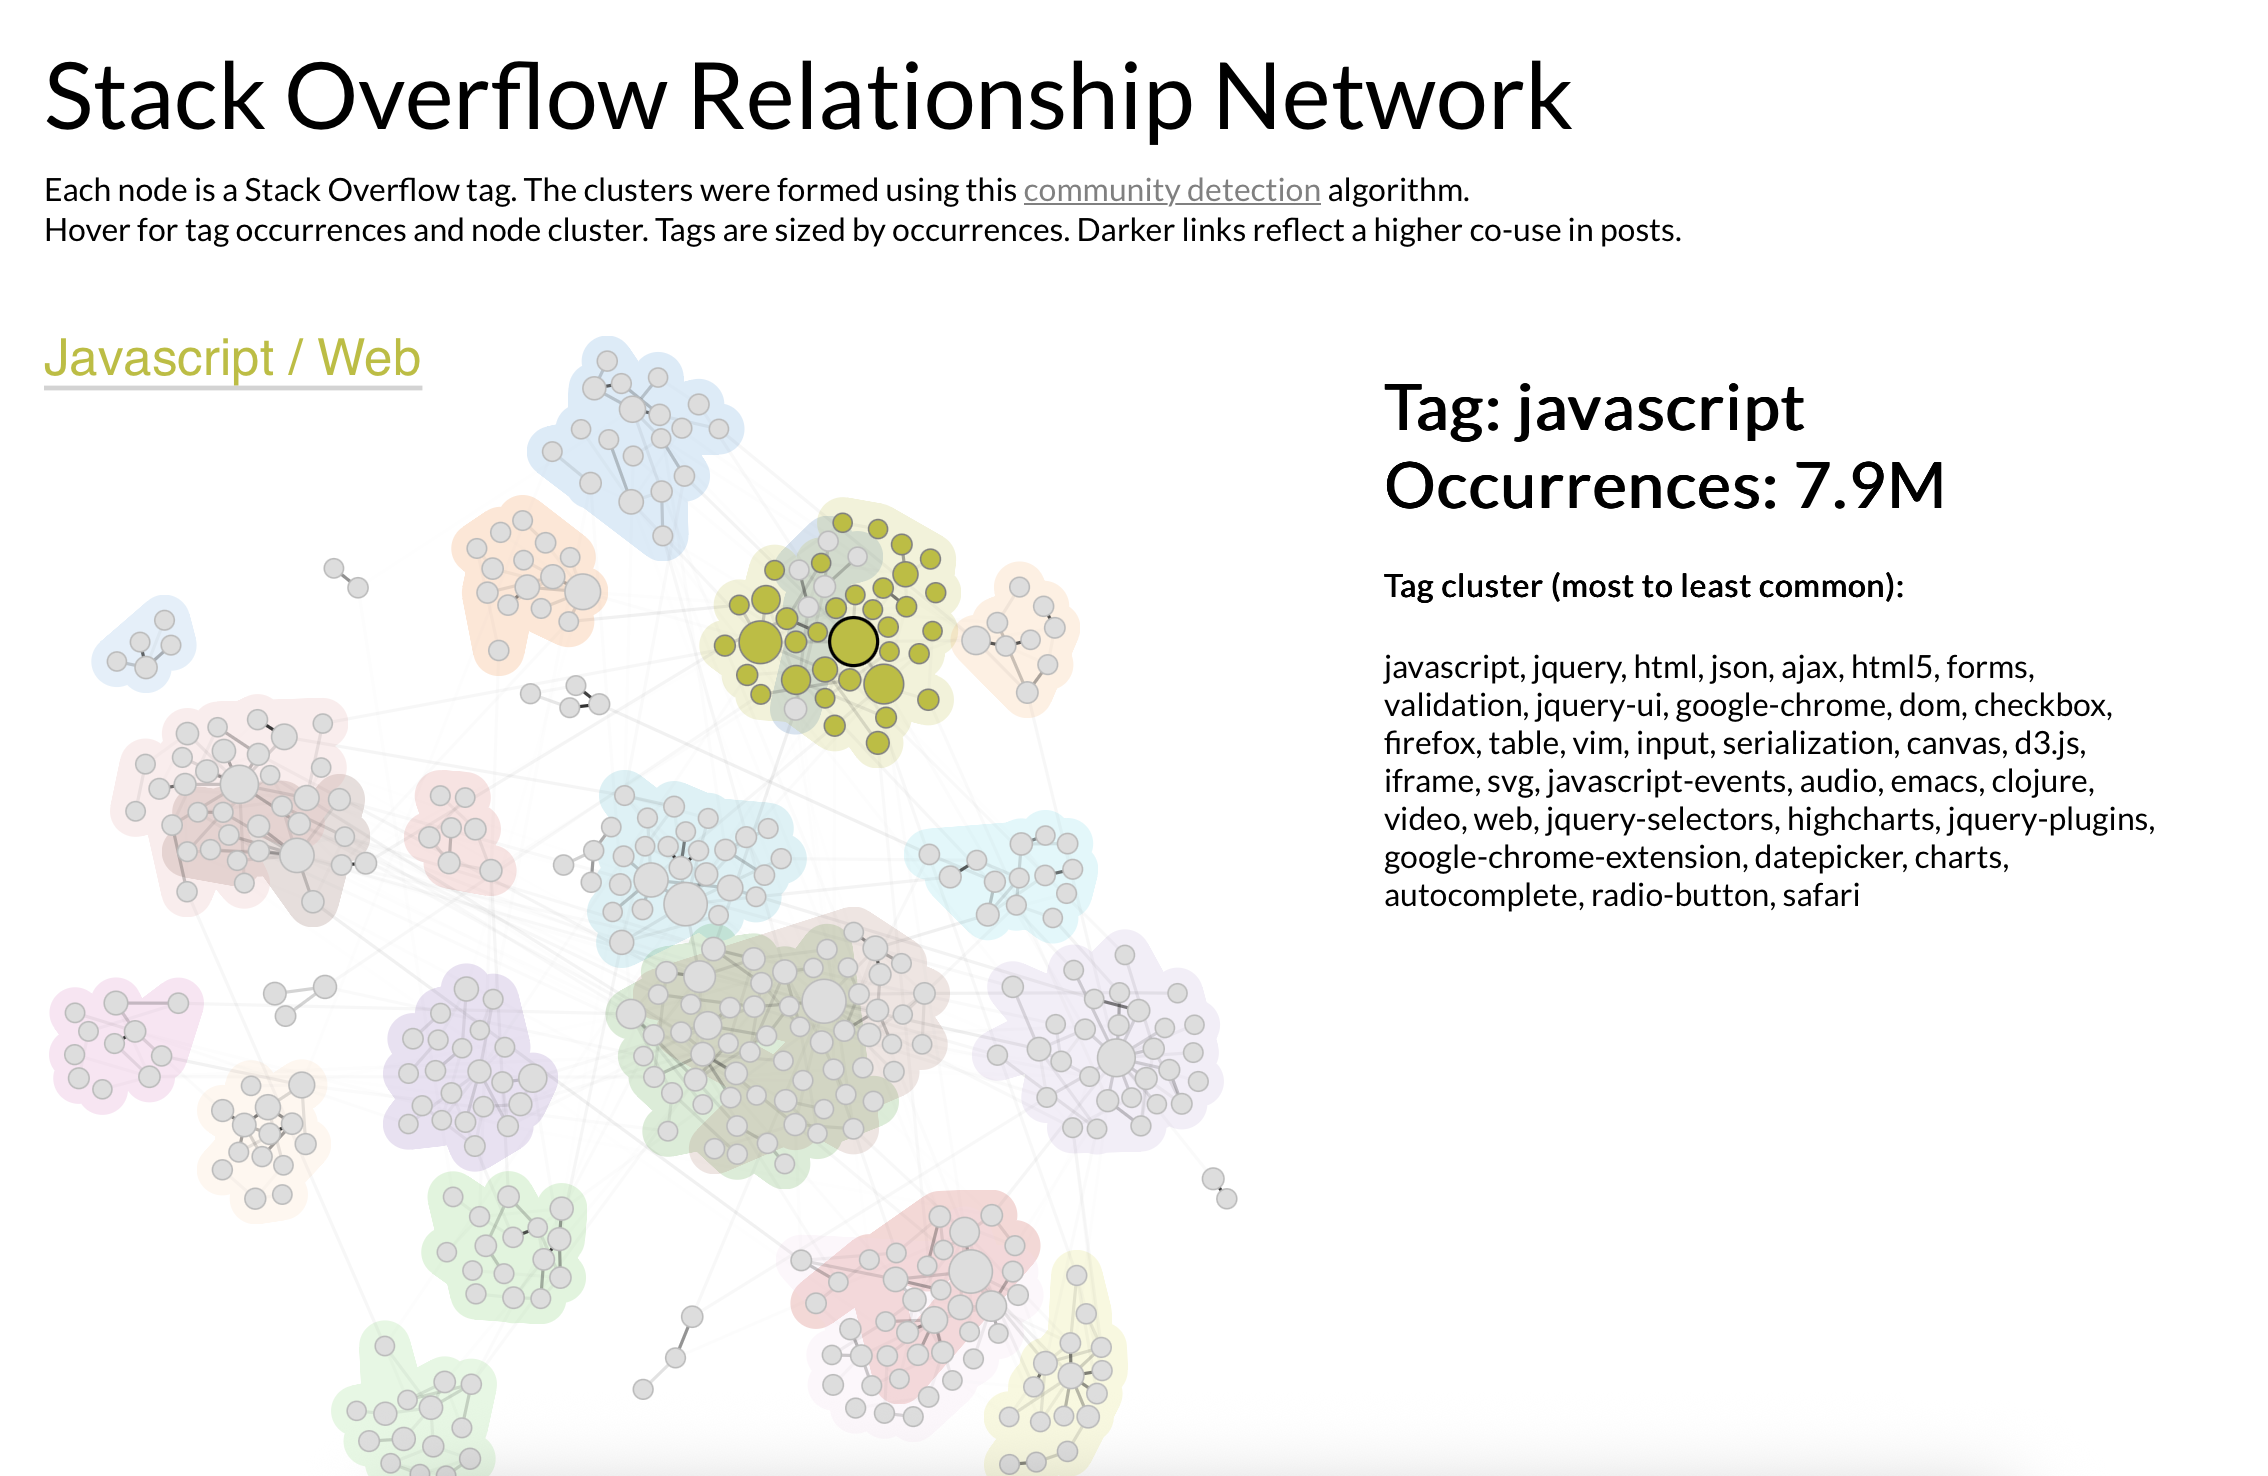
Visualizing Programming Behaviors with Stack Overflow
Designed and shipped an interactive exploration of developer tag co-occurrence on Stack Overflow — revealing how programming communities cluster and evolve.
Research & Publications
- Best Paper — VDA 2020 Haber, C. & Gove, R. "A Visualization Tool for Analyzing the Suitability of Software Libraries via Their Code Repositories."
- ACM BELIV Workshop Haber, C. (contributor). "Do Defaults Matter? Evaluating the Effect of Defaults on User Preference for Multi-Class Scatterplots."
- US Patent 11,487,538 Methods for evaluating software libraries via repository analysis.
Education
B.S. Computer Science, Minor in Design · University of San Francisco
- Teaching Assistant — Data Visualization (CS360), Assembly & CPU Design (CS315).
- Research Assistant — Data visualization research (multi-class scatterplot defaults, published at ACM BELIV) and African American Studies research.